Projects
Service Design
10 months and 3 days
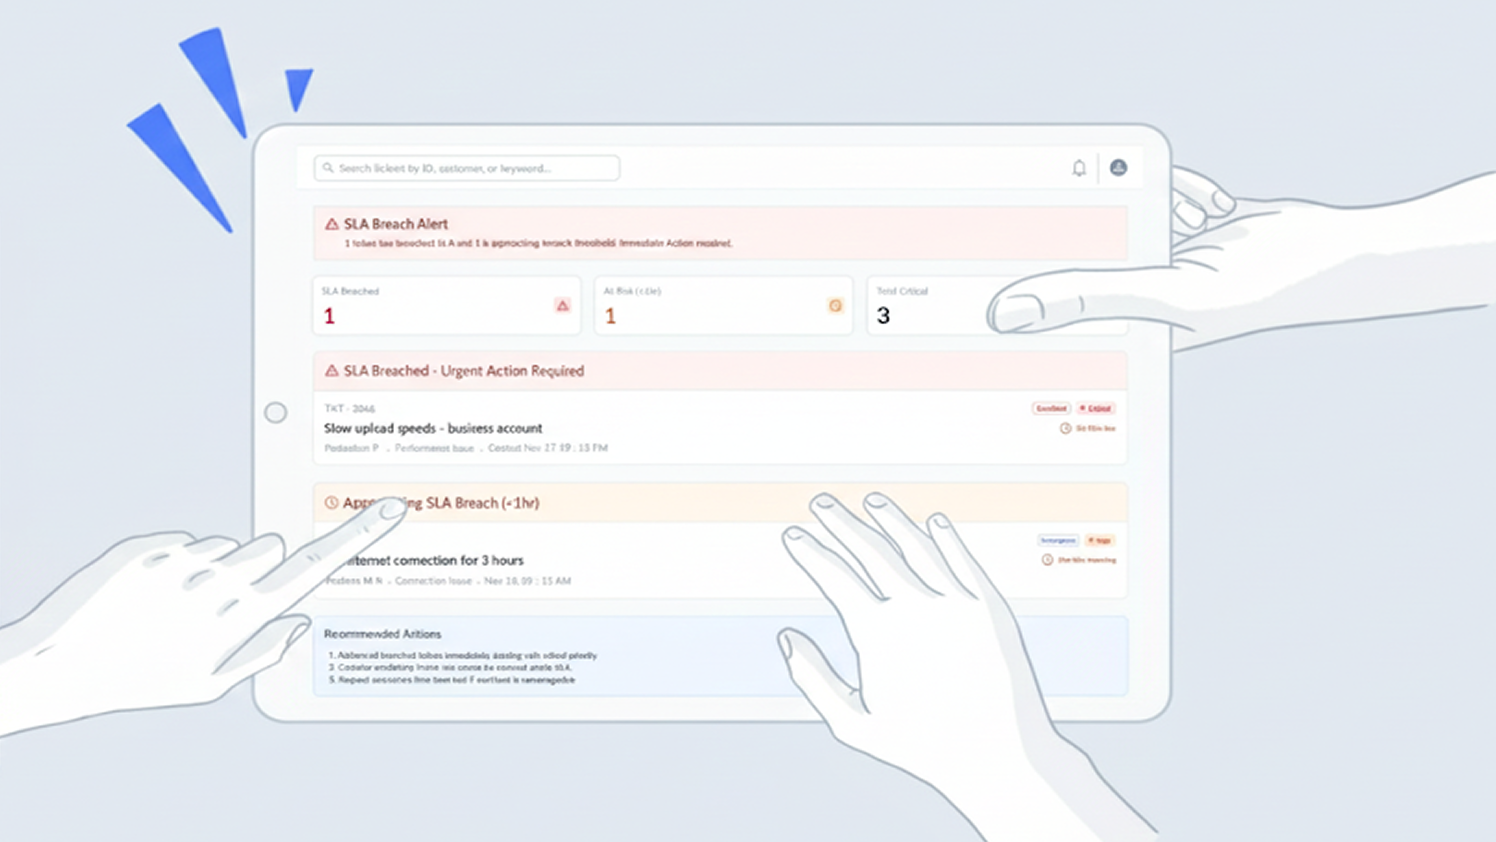
A system-focused UX case study exploring how a call-based support operation can be transformed into a structured, SLA-driven internal support system. The project focuses on agent and supervisor workflows, emphasizing visibility, accountability, and scalable decision-making in high-pressure service environments.


Tangible Data Visualization
1 month, 3 weeks and 1 day
Biodiversity is vanishing at an alarming rate, with many species moving closer to extinction. This project visualizes the survival status of 24 selected species from India, chosen to reflect different habitats and IUCN Red List categories. Using a layered paper-cut lightbox, the arrangement shows species sinking deeper as their threat level rises, and color bands indicate population size. The work combines data and emotion to make the crisis of extinction tangible and immediate.


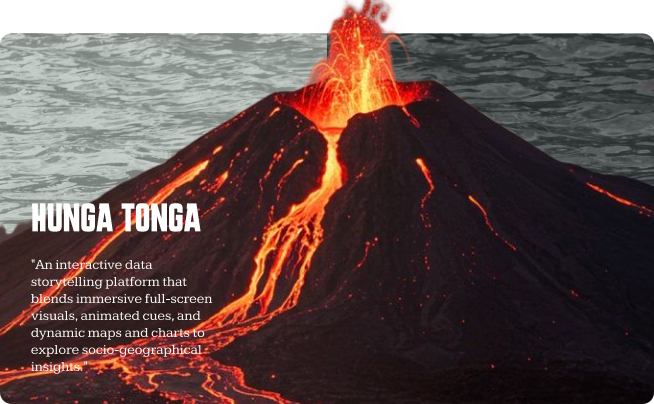
Data-Driven Narrative
1 week and 6 days
This project visualizes the 2022 Hunga Tonga-Hunga Haʻapai eruption - from its underwater build-up to the record-breaking 57 km plume and its global aftermath. Using scientific records and satellite data, I built a timeline-based narrative with layered visuals and annotations to reveal how the volcano formed, evolved, and erupted, and to compare it with other historic eruptions.